The study of receptor distribution patterns is important for investigating receptor systems and characterizing them as potential therapeutic targets.
One of the techniques used to describe the distribution of the cell membrane proteins is immunogold labeling, which is one of the most sensitive methods for performing these studies at the nanometer scale.
We have reported a new transmission electron microscopy (TEM) sample preparation method for immunogold labeled samples, which allows the study of the distribution of membrane proteins on the cell surface with much higher statistical accuracy than before. The protocol was divided into 2 parts, for sample preparation and data evaluation:
The first part describes suitable sample preparation for TEM imaging: After the conventional TEM immunogold sample preparation (cell labeling, fixation, drying) we have applied a new sample thinning procedure that is actually a chemical etching, that was performed with a sodium hydroxide solution. Thus, the sample is ready for TEM recording (detailed steps can be found in the article).
The second part contains data analysis and evaluation. Here, the gold beads were identified on the digitized TEM images using the ClickOnGold program, and then the pair correlation and pair cross-correlation functions were determined with the Gold program.
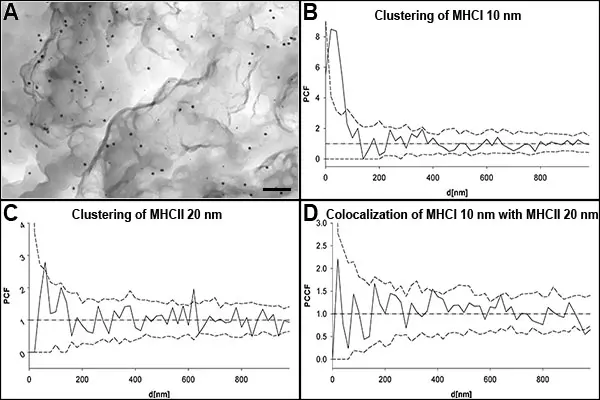
The typical results of immunogold labeling are shown in the figure, where panel (A) shows TEM micrographs of double immunogold-labeled proteins (MHC I and MHC II) on the membrane surface of JY cells, with 10 and 20 nm gold beads. Panels (B) and (C) show the pair correlation function (PCF) of MHCI and MHCII, and panel (D) shows the pair cross-correlation function (PCCF) of MHC I and MCH II proteins. The pair correlation functions assume clusters of MHC I between 10 and 380 nm and MHC II between 20 and 650 nm. The cross-correlation function shows a weak cross-correlation between MHC I and MHC II at approximately 380 and 620 nm.
Authors: József Kormos, Lajos Daróczi, János Szöllősi, László Mátyus, Attila Jenei